Reporting management
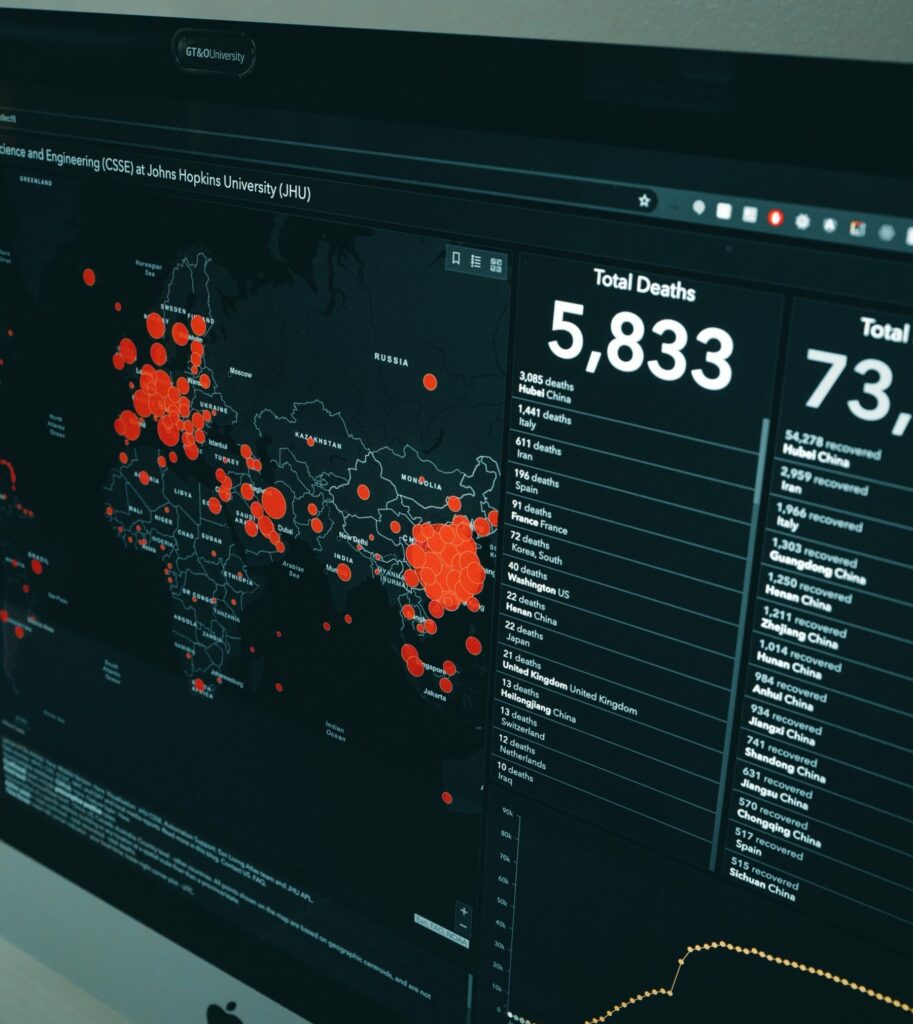
Project and programme reporting management has never been more critical to making informed, evidence-based decisions by leveraging data analytics and visualisation.
Reporting management requirements
Static PowerPoint or Keynote
Manually compile static dashboards using PowerPoint or Keynote and external data sources.
Single-source BI dashboards
Develop a dynamic BI dashboard while consulting data from Access, Excel or a database.
Linked multi-source BI dashboards
Develop a self-refreshing multi-page BI-enabled dashboard while integrating multiple datasets.
Reporting management in action
Rich user experience
Interact with the dashboards by filtering, selecting specific themes and dropdown options to ease the data interpretation.
Integrate multiple data sets
Interlink and query virtually unlimited data sources to draw and interpret unique findings to support your decision-making process.
Automated dashboard refresh
Optimise your resourcing requirements by scheduling your dashboards to refresh automatically at certain times or semiautomatically with a button push.
Automated data cleansing
Leverage powerful functions to clean up data sets before integrating the information into dashboards.
Diverse dashboard designs
Design multiple dashboards using a single data set to simultaneously respond to various stakeholder requirements.
Reporting management technologies
Find out which dashboard technology suits your business based on your stakeholder requirements.
Managing dashboard development
One can also download static dashboards and interpret information offline in most cases, given no dependency on a SharePoint site or Microsoft Teams. Find out which type of dashboard technology is suitable for your
We create a reporting centre of information for every client, involving a dedicated hub to gather and organise all the essential data and information for your projects or programmes. This centralised location ensures easy access to the information you need.
Managing reporting channels
Static dashboards are quick to build; they require very little technical preparation and software support and leverage Microsoft PowerPoint or Apple Keynote.
Bespoke reports
You can quickly create fully tailored PowerPoint or Keynote presentations using pre-built shapes and charts to convey a clear message within minutes.
Sharing reports
The static dashboard can be exported as OCR-ready PDF files and emailed to facilitate information distribution across multiple stakeholders to manage their expectations.
Accessibiity
Popular file formats like PDF, PPTX (PowerPoint) or “.KEY” (Keynote) are compatible with mobile devices’ Dropbox, Box, and other file-sharing technologies.
Data management
Static dashboards do not introduce a dependency on a sophisticated technical process, such as correlating or integrating multiple data sets or defining data types.

Why is reporting management critical for business success?
Teams productivity
Agile Scrum teams outline epics and user stories, burnout charts, utilisation vs benching rates, attrition, and sickness rates.
Project planning
Multi-level Gantt project planning filterable by workstream, department, activity owner or completion percentages.
Inflight deliverables
A detailed schedule for contractual deliverables with RAG information reflects first and final draft dates and sign-off milestones.
Risk management
Risks and issues management reflected with mitigation action owners and due dates; leverage Gantt views for mitigation action management.
Dependency mgmt
Correlate project activities with project dependencies to weight potential delivery risks; RAG dependency fulfilment.
PMO management
Manage PMO governance via BI capabilities, including reflecting meeting dates, post-meeting minutes, actions and owners.
Reporting management in private and public sectors
Private sector
Private organisations leading projects can rely on our reporting management service. We assist private firms in streamlining their project reporting activities using technologies such as Power BI and Tableau.
Our service ensures that all stakeholders have access to accurate and up-to-date information, which is crucial for making informed decisions. In return, this investment helps CXOs maintain their competitive edge.
Public sector
Public agencies and governmental departments find immense value in our reporting management services. Government-led projects often involve multiple stakeholders and complex reporting requirements.
Our service simplifies the reporting management process, ensuring that government projects stay on track and within budget. We provide purpose, transparency and accountability, which are vital in the public sector.
Reporting management is an enabler
Integration
We gather and integrate data from various sources. This involves collecting data from your organisation's departments, systems, and tools. We combine all this data into one coherent and comprehensive report, providing a holistic view of your project or programme.
RACI
We determine who owns each data feed. We establish clear roles and responsibilities for each data source to ensure clarity and accountability. This is known as the RACI framework (Responsible, Accountable, Consulted, Informed). This helps maintain the integrity of the data.
Accuracy
We engage with the project or portfolio leads to validate the information. Our team collaborates closely with project leads to verify the accuracy of the data included in the reports. This validation process ensures that the reports are reliable and reflect the current state of your projects.
Managing reporting requirements
Reporting on RAID escalations
Project risk and issue escalation is an integral part of our service. We have a robust mechanism to address project risks and issues promptly. If any potential risks or issues are identified, we escalate them to the appropriate individuals or teams for immediate attention and resolution. This proactive approach helps mitigate risks and minimise project or programme disruptions.
Managing end-to-end reporting
Our reporting management services significantly benefit programmes by providing a comprehensive overview of the entire programme, enabling better decision-making. Programme managers can easily track progress, identify bottlenecks, and allocate resources more effectively. This service also enhances communication and collaboration.
Mobilise the "single source of truth"
Our reporting management service establishes a central hub for information, integrates various data sources, defines clear ownership, engages with project leads, and manages risk and issues effectively. This service benefits programmes, private organisations, public agencies, and governmental departments. We empower organisations to make informed decisions.